What can clinic videos achieve? Two Clinicast customer cases
You can watch a sample video and decide whether you like the edit. It is harder to tell what publishing those videos will do for your clinic. These two customer cases offer a closer look: a smaller account gaining followers, a second clinic reaching more accounts, and the questions worth asking before you compare either result with your own.
Instagram followers · 83 more followers
Accounts reached · 23.2% increase shown in Insights
Dr. Georgina Aizenberg: 83 more followers on a smaller account
Georgina’s Instagram account had 679 followers in the first profile screenshot and 762 in the second. That is a gain of 83 followers, or 12.2%, during what her customer case describes as a 30-day period. You can see both counts in the images below.
Her case reports that she used Clinicast and published on her own channels without ads, an agency or a filming crew. For a clinic with someone willing to explain things on camera, that is a useful example of a content workflow without an outside production team.
The starting point matters. This account began with fewer than 700 followers. When you review your own progress, keep that starting number beside the percentage: it gives the change a scale you can actually picture.
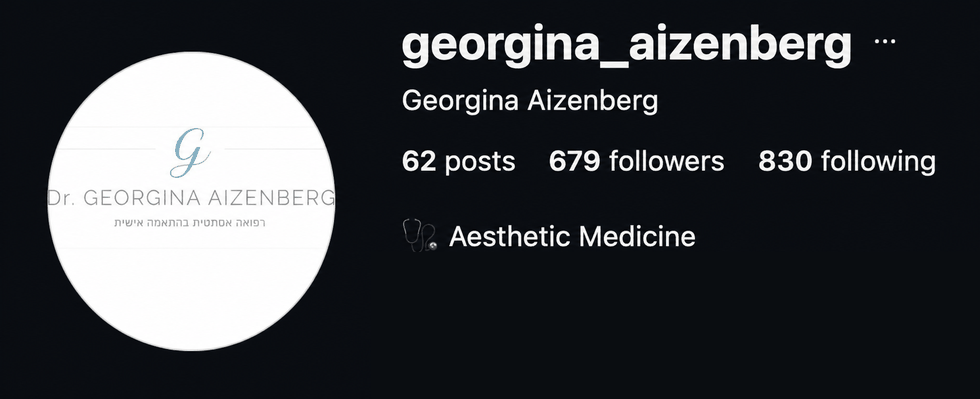
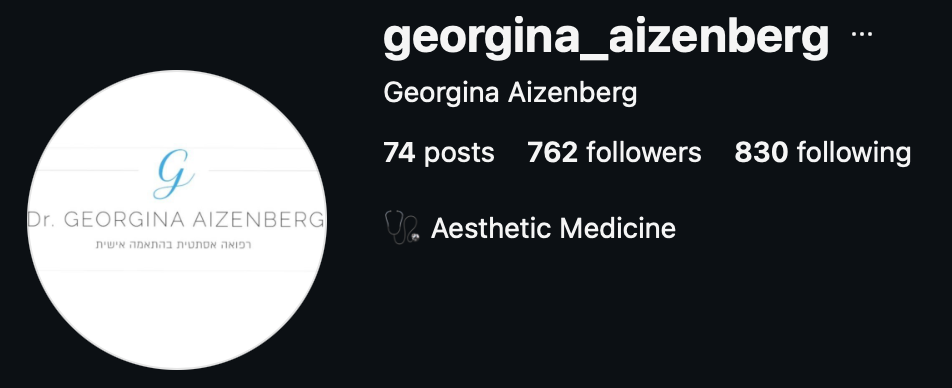
The customer case describes a 30-day period. Dates are not visible in the images.
Dr. Meytal Kavalerchik: reaching 22,002 accounts
Meytal’s case offers a different view of progress. The supplied Instagram Insights image shows 22,002 accounts reached and a 23.2% increase. Her published case describes a month of activity.
Reach is the number of accounts that saw content, including people who may never have followed the clinic. It helps you understand how far the content travelled. Enquiries and bookings tell you what happened after someone saw it.
Paid promotion was part of this case. The clinic reported no increase in paid-media spending during the period. Keep that context when comparing it with Georgina’s reported no-ads workflow.
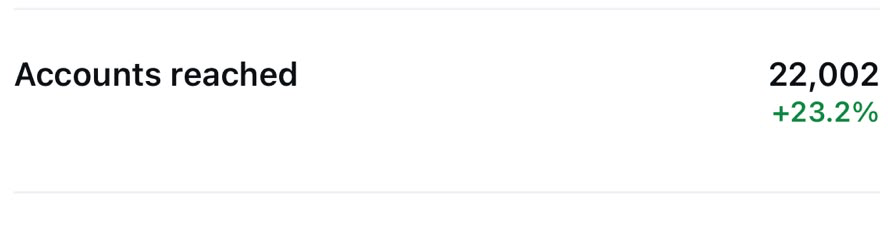
Reporting dates and the paid/organic split are not shown in this crop.
Choose what you want your next month of content to do
The two cases give you different measures to consider: follower growth and reach. Your own next step might be simpler. Can the team finish and publish videos regularly? Which explanations make prospective patients ask useful questions?
Start with a topic you already explain well, such as what happens at a first consultation. Describe your actual process and give viewers a relevant next step. Note the topic and the invitation so you can connect later enquiries with the content people remember.
Keep a scorecard you can use next month
Save your starting follower count and account insights. Record the dates, the videos you publish and any promotion spend. Compare periods of the same length, and note other offers or campaigns running at the time.
Track enquiries and bookings separately from reach and views. Ask people who contact the clinic how they found you and whether they remember a particular video.
Then look at the work behind the numbers. Which topics brought relevant questions? Which videos were easy to finish? Where did the team get stuck? Use those answers to choose the next topics and improve the recording routine.
| Track | Record |
|---|---|
| Publishing | Dates and videos posted |
| Distribution | Reach and promotion spend |
| Audience | Starting and ending follower counts |
| Business response | Enquiries, bookings and how people found you |
Make your first example with your own clinic
Seeing another clinic’s results is useful. Making a video with your own material tells you whether the process fits your team. Create a clinic profile in Clinicast, choose a question, review the script and record your explanation. Check the finished edit, captions and branding before publishing.
The first-video signup offer lets you try that workflow. Start with an explanation you would happily give in person. You will have a finished video to judge and a starting point for measuring what happens next.
See examples of the clinics' videos
Common questions
Where do these figures come from?
They come from the customer cases on our homepage and the supplied Instagram screenshots. The images show follower counts and total reach. Reporting periods, workflow details and the paid/organic split come from the case reports; exact dates and the split are not visible in the crops.
Do these results show what my clinic will achieve?
No. These are individual customer experiences. The screenshots do not isolate the effect of Clinicast from other content, advertising or changes at the clinic. Your audience, content and distribution will affect results; the same growth or bookings are not guaranteed.
Did both clinics get these results without advertising?
No. Georgina’s case describes no ads during the reporting period. Meytal’s case includes ad-assisted reach and reports no increase in paid-media spending.
Where can I see the clinics’ videos?
The customer stories on our homepage include video examples from both clinics. Use those to judge the content itself alongside the results shown here.